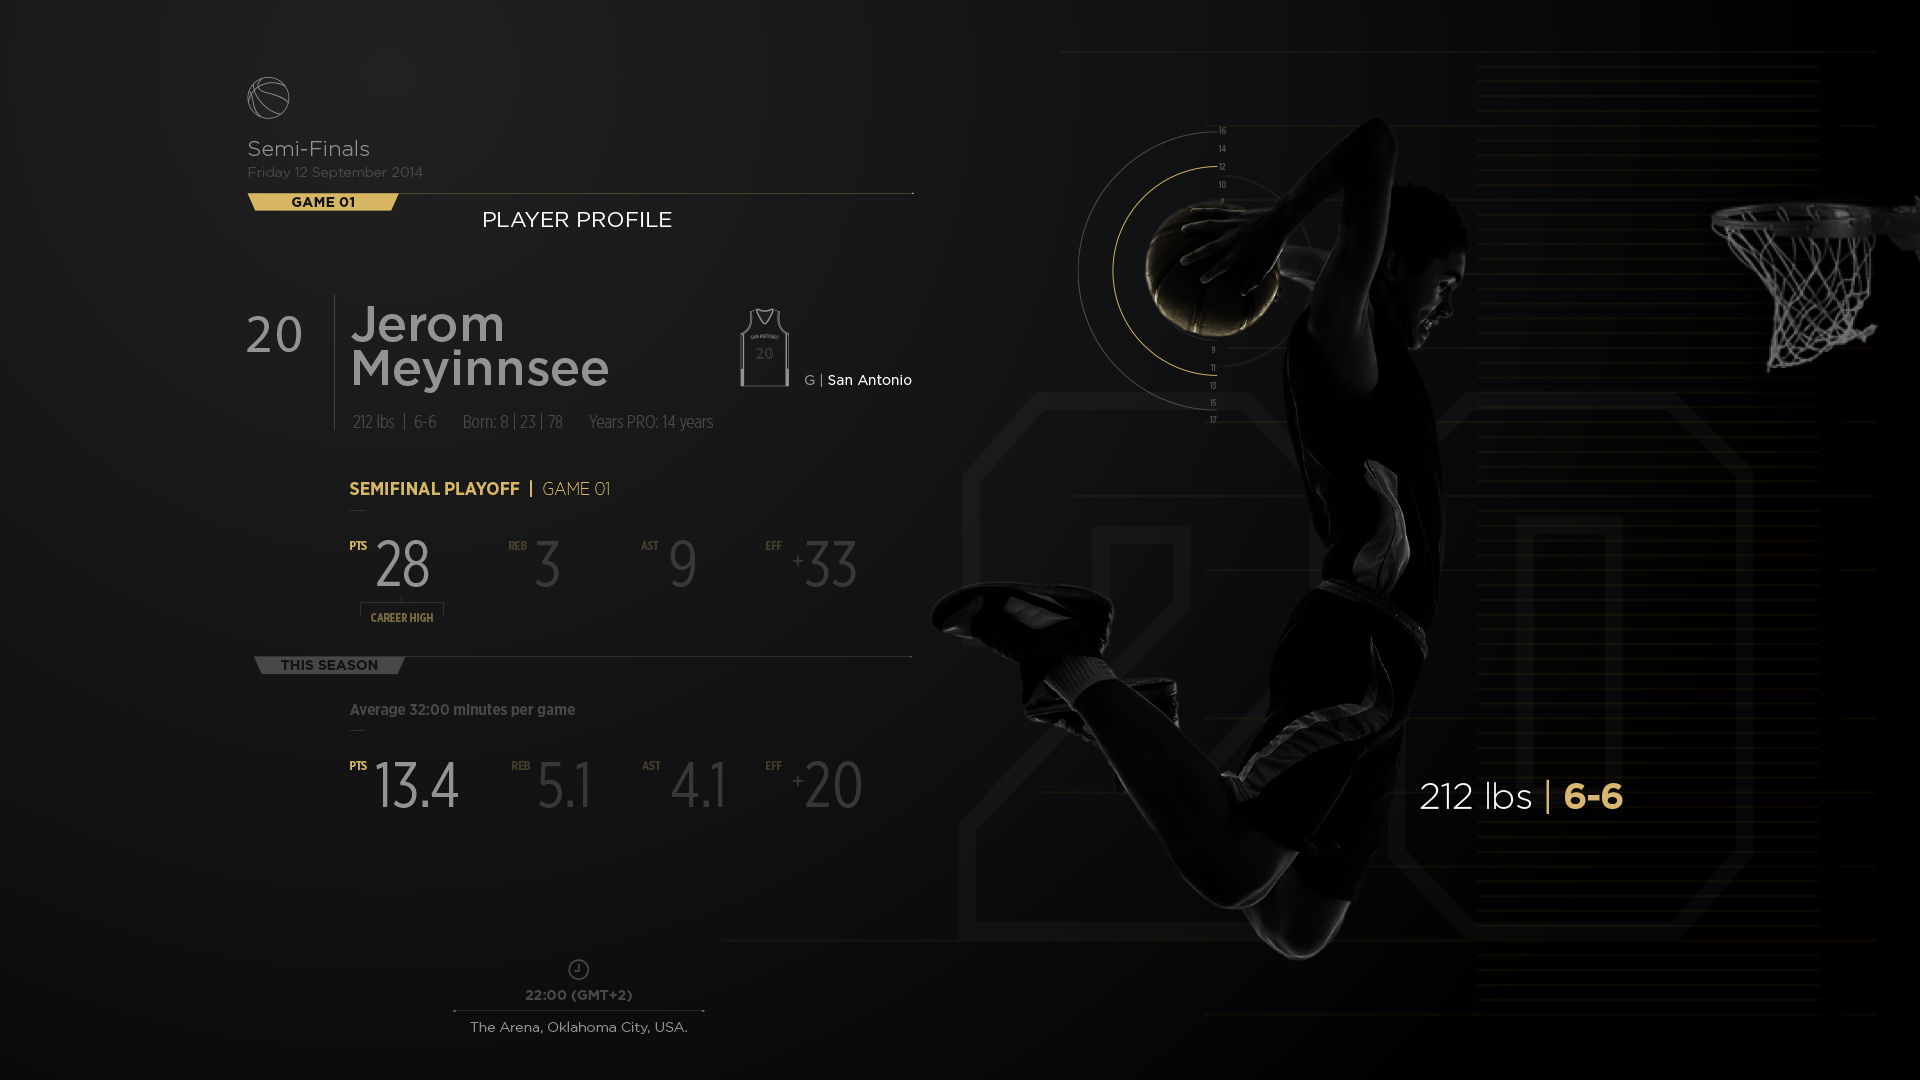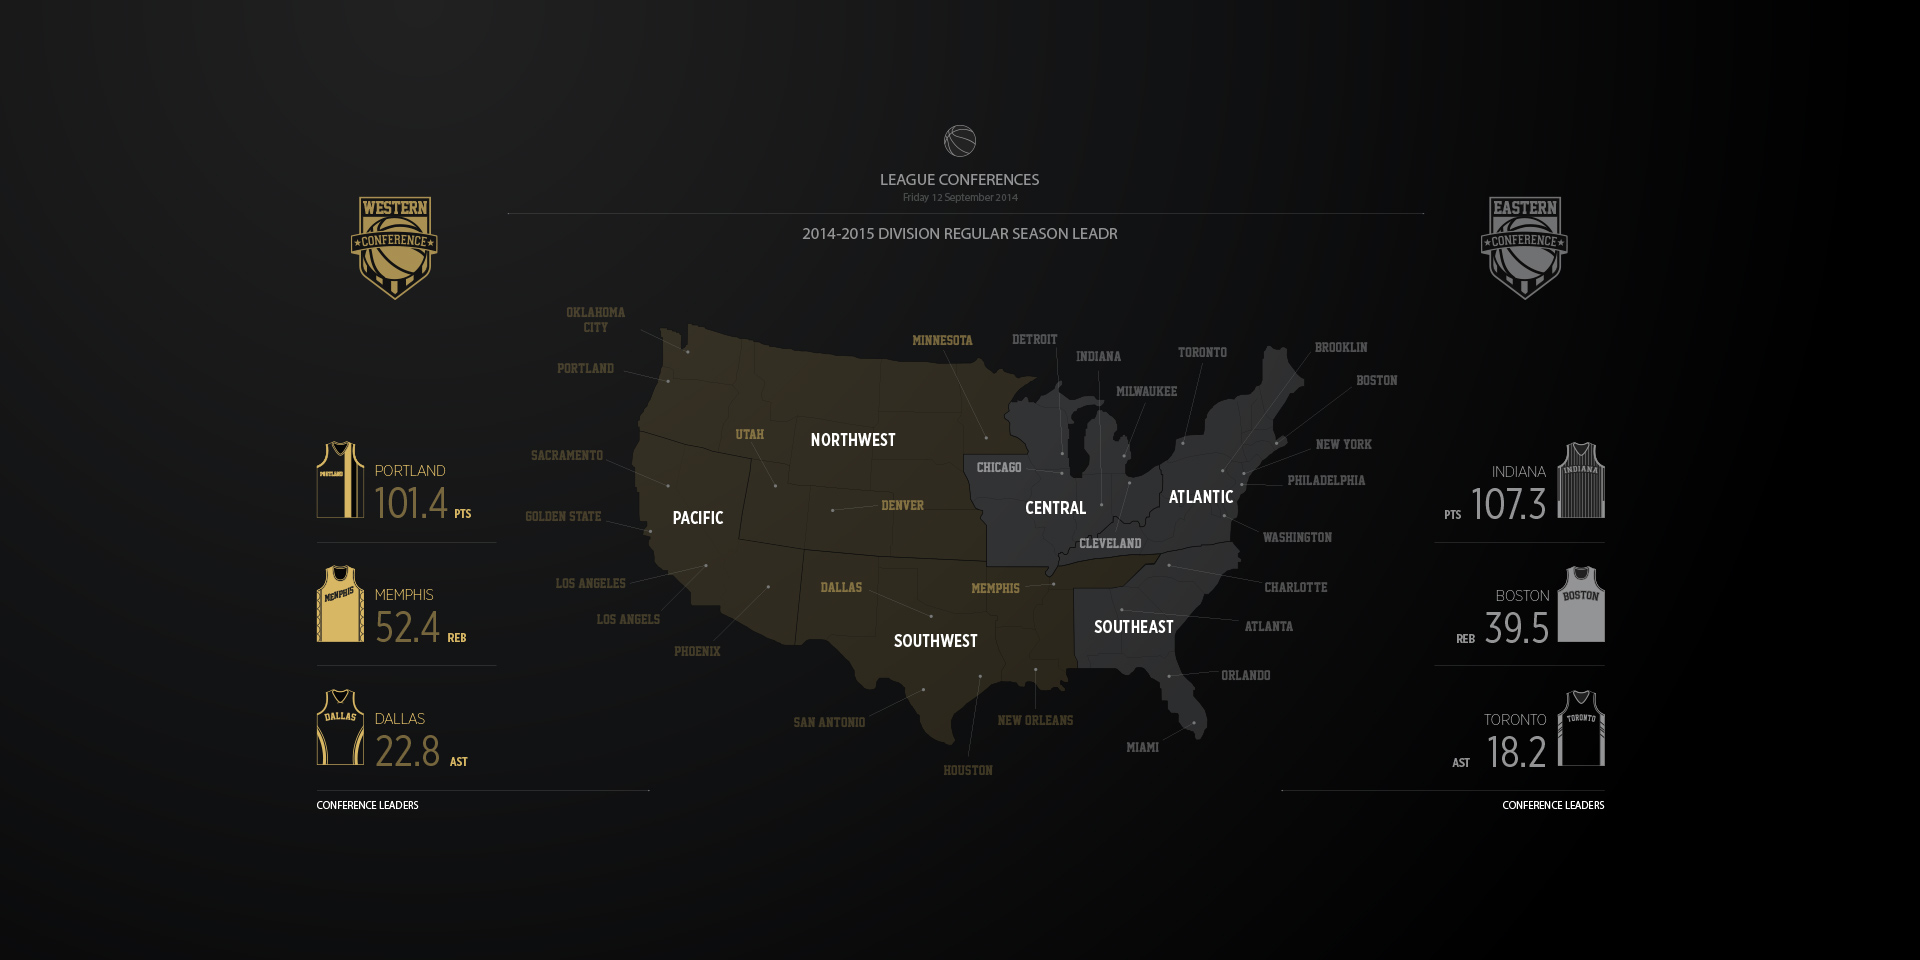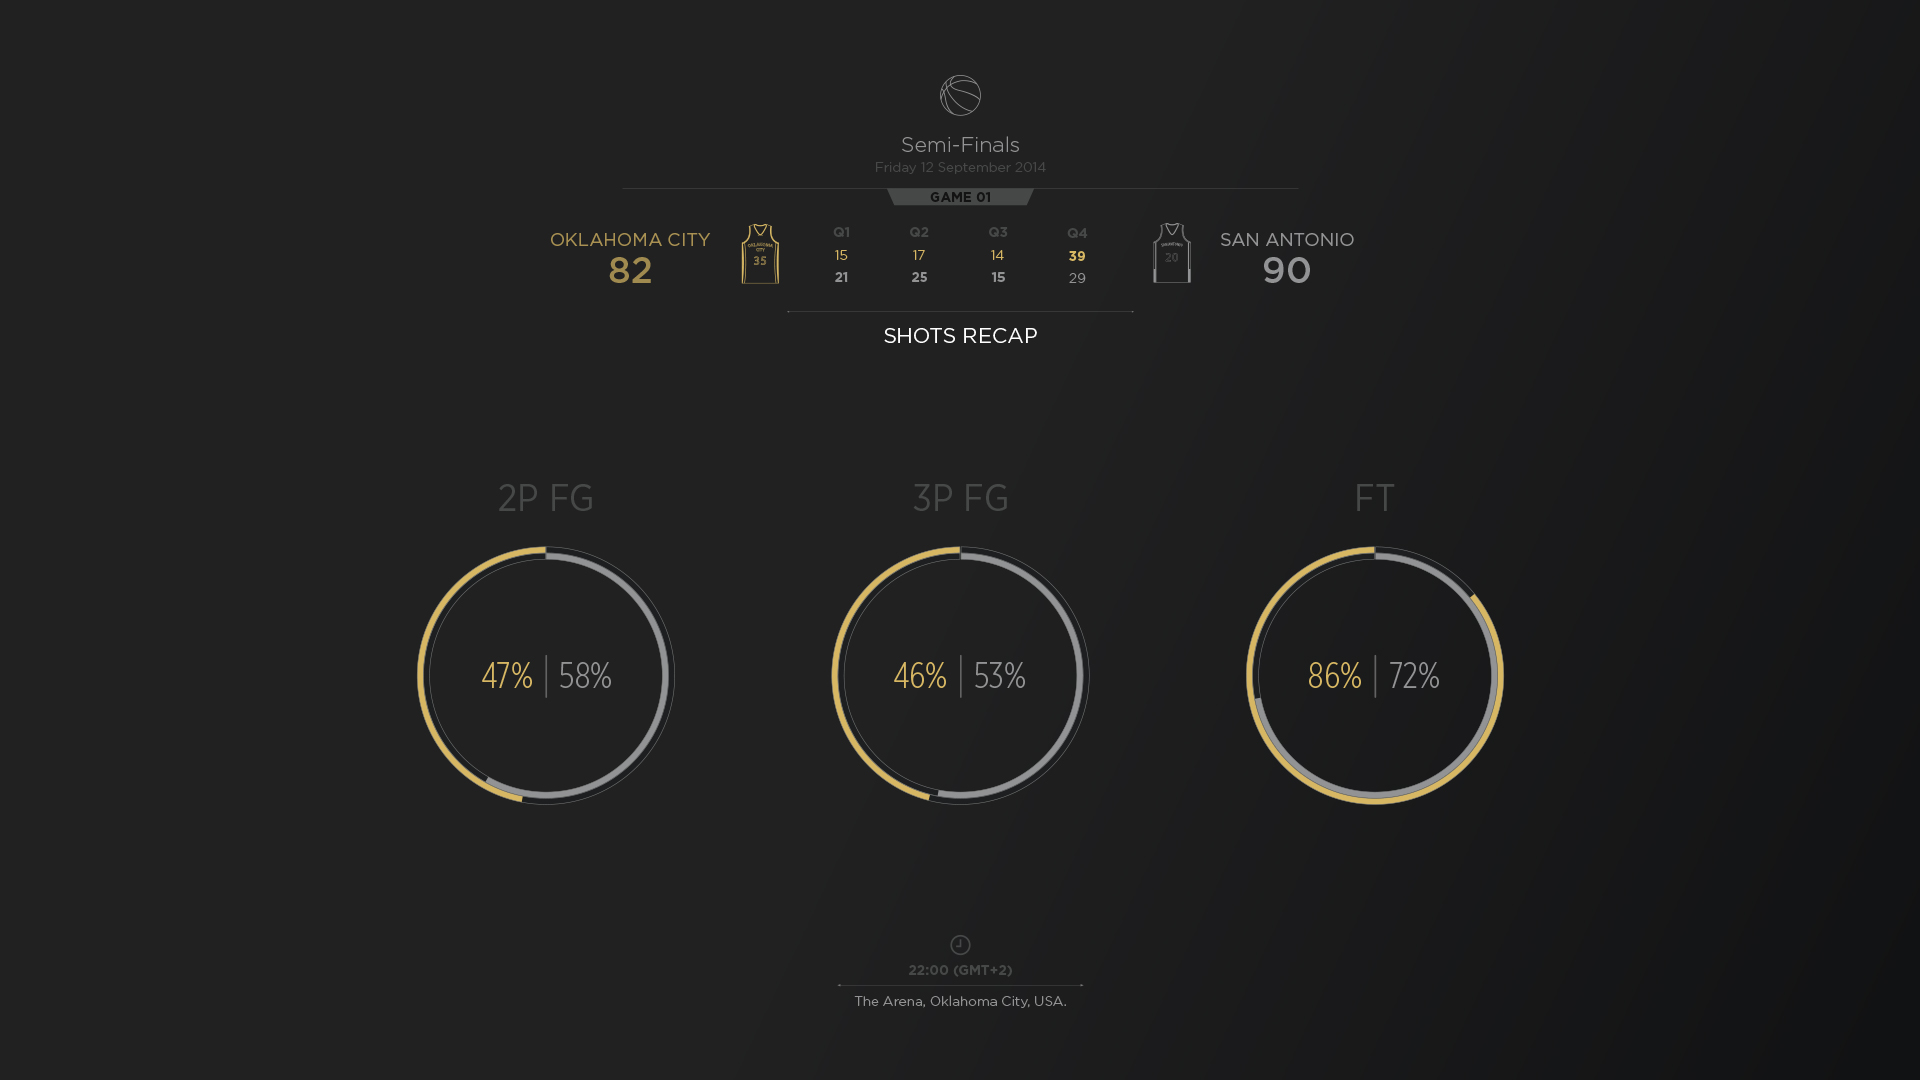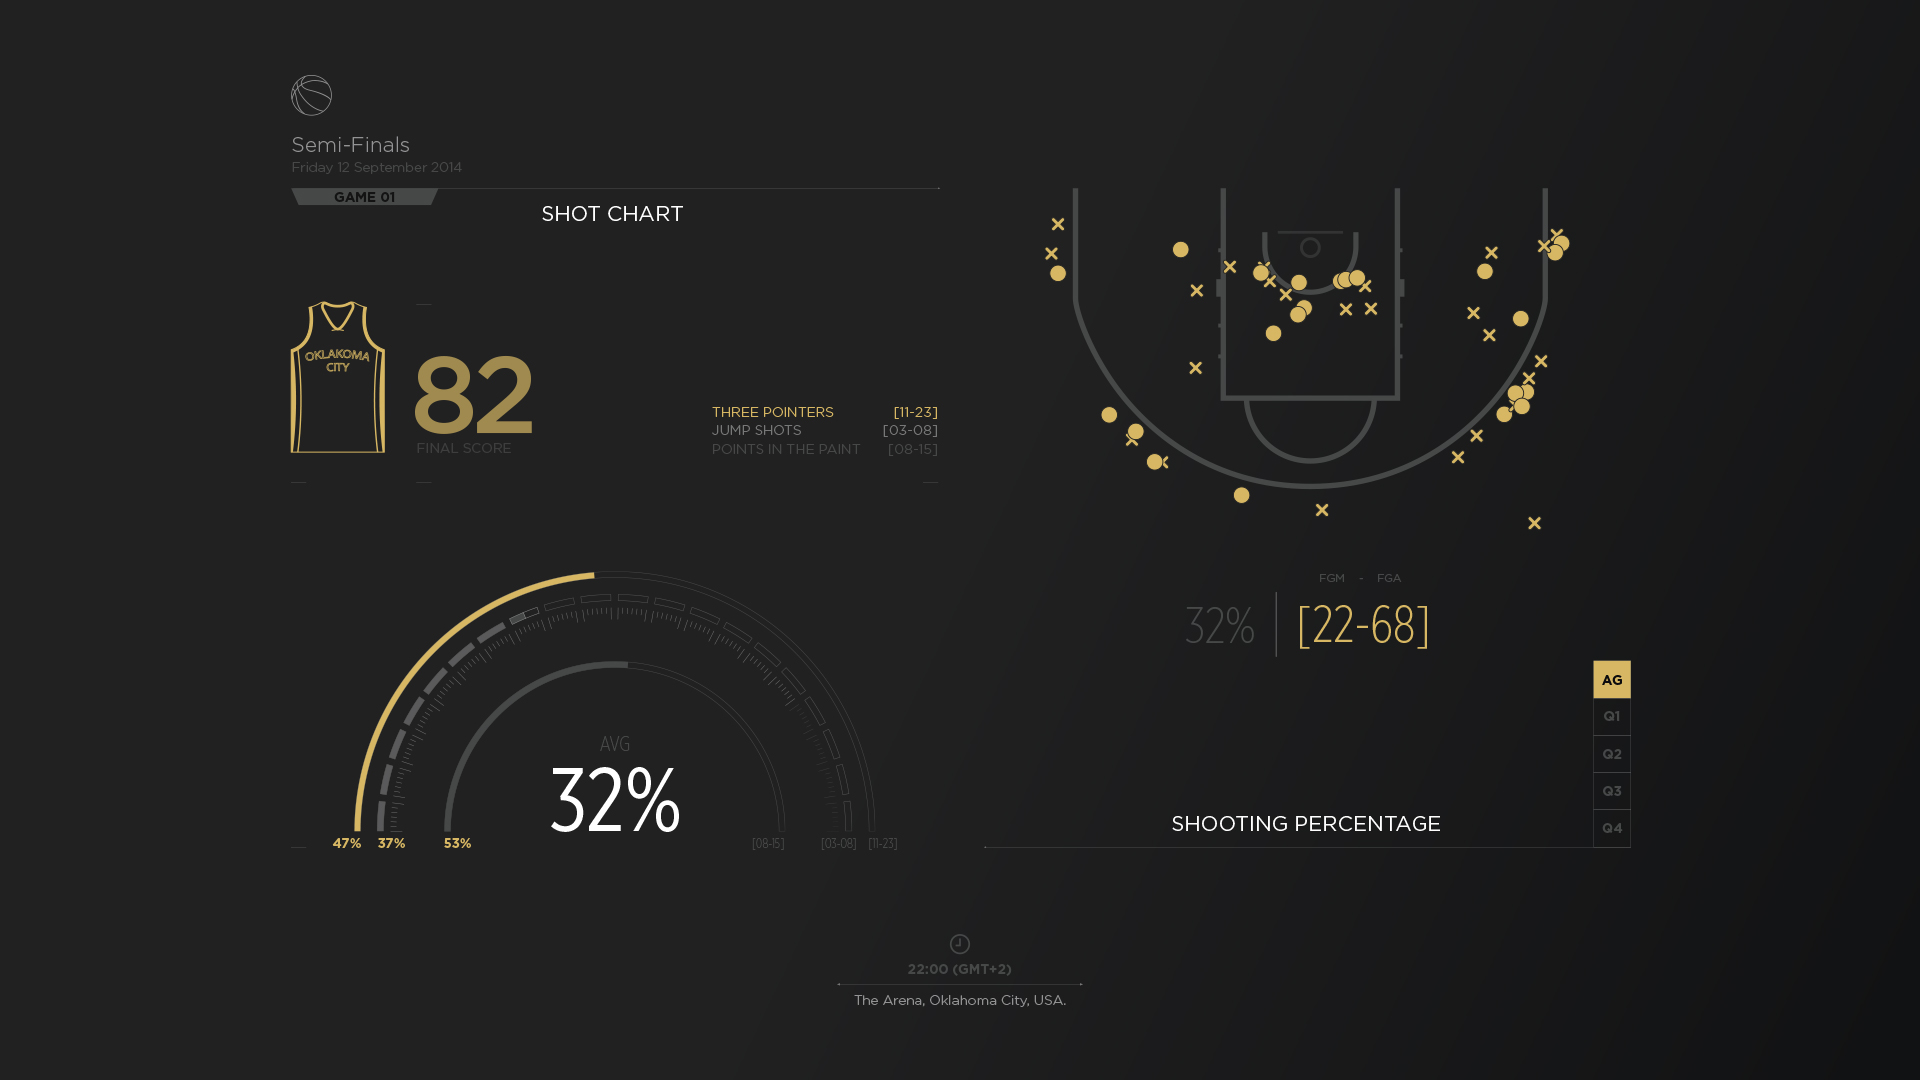
Basketball Statistics
Pixeden
Project Date
May 2016
Our Work
Infographics / Data visualization
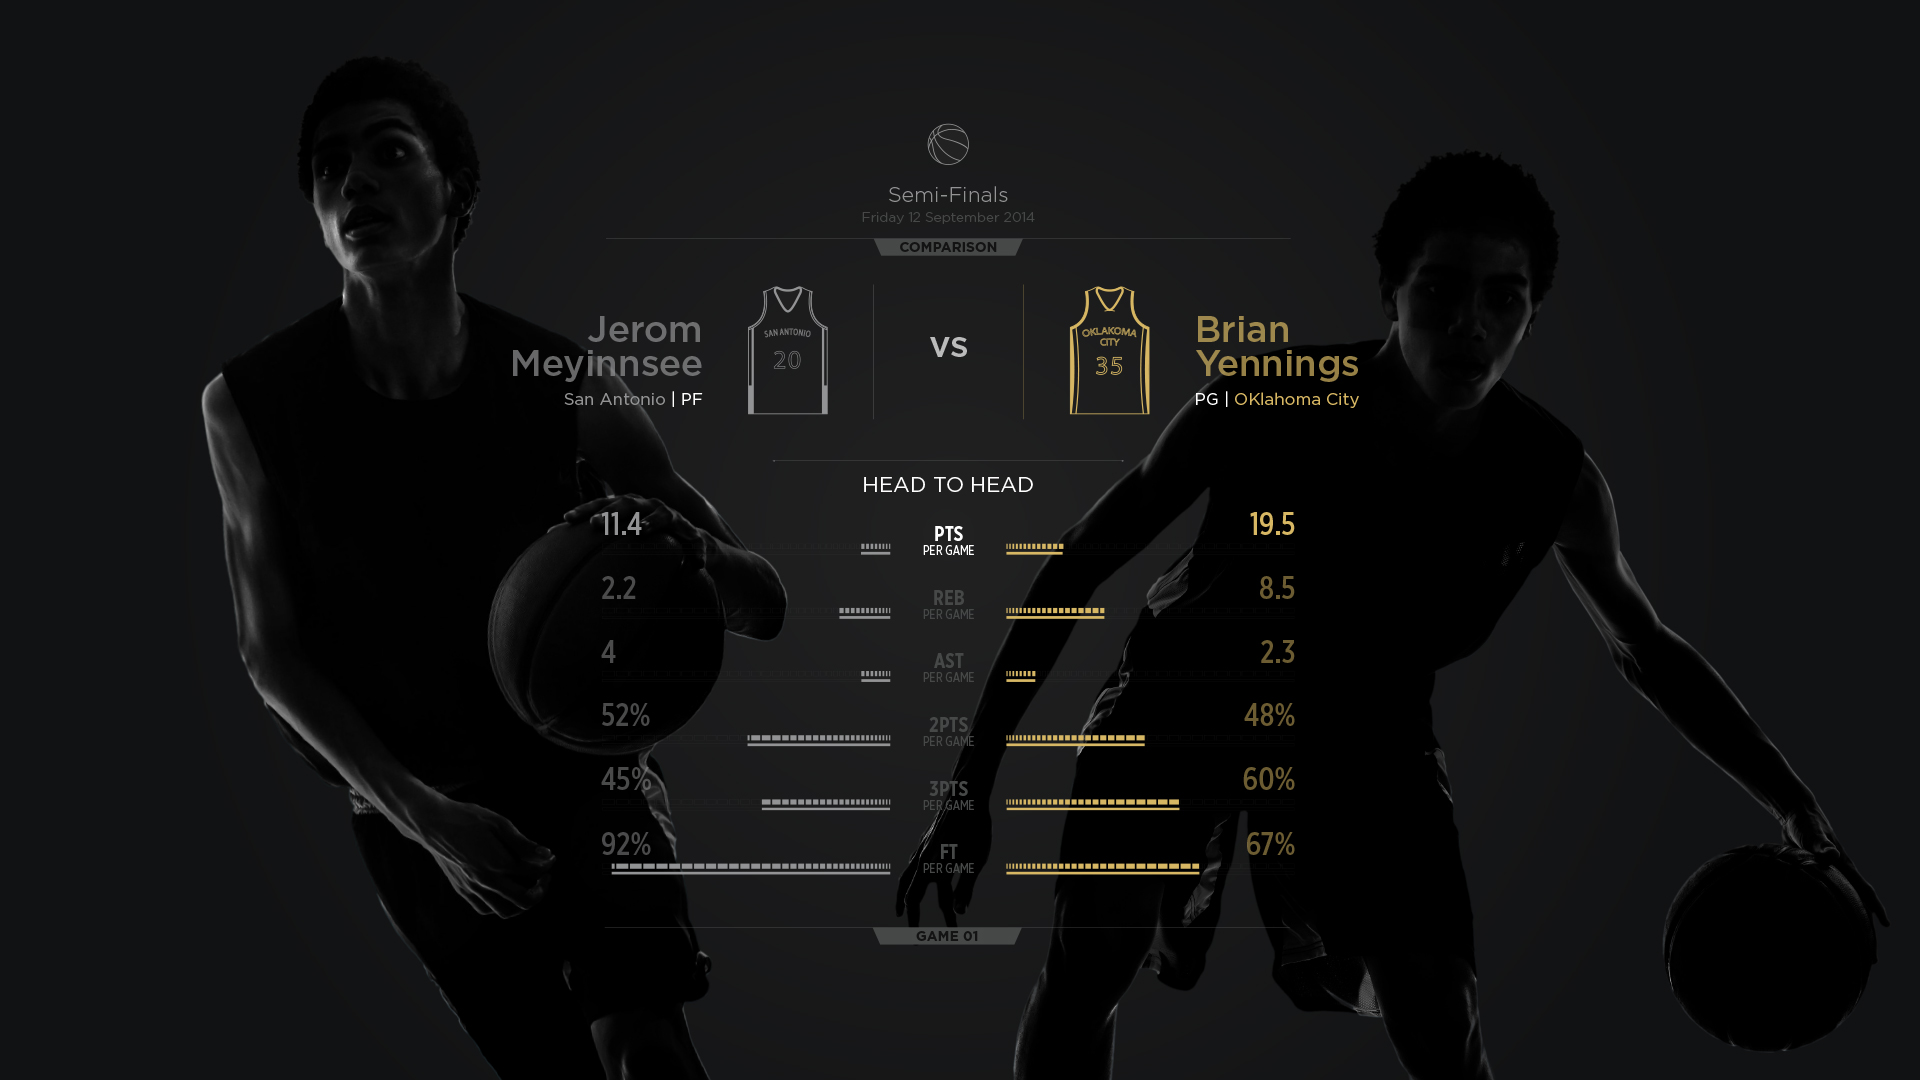
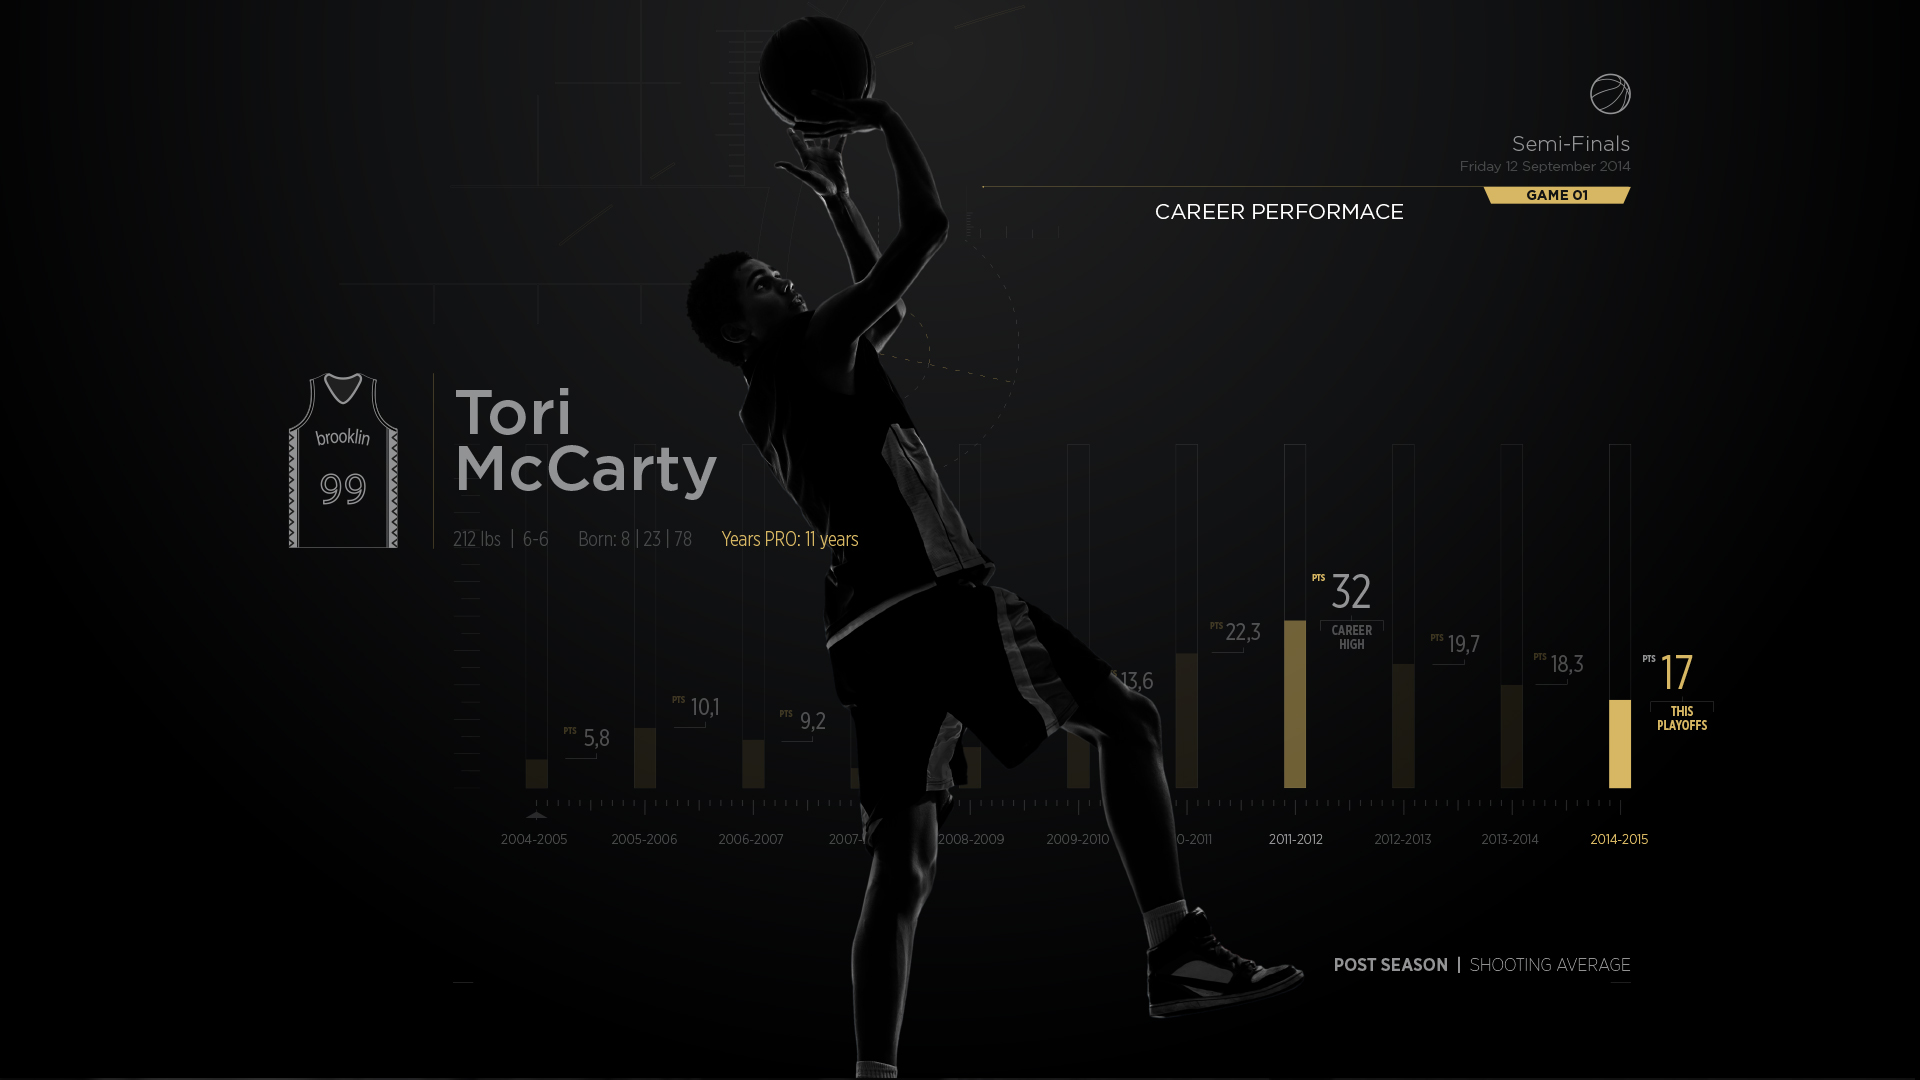
We love infographics! Data can be easily digested when it is well presented. A good chart can make simple what it looks like a complicated puzzle.
This is a set of statistical tools designed for Pixeden and oriented to sports (basketball in this particular case). We created for Pixeden a premium system of elements which provides users the possibility of customizing their own visual information. It provides different possibilities of presenting statistical information such as maps, pie charts and diagrams, among others.
